Simultaneous equations
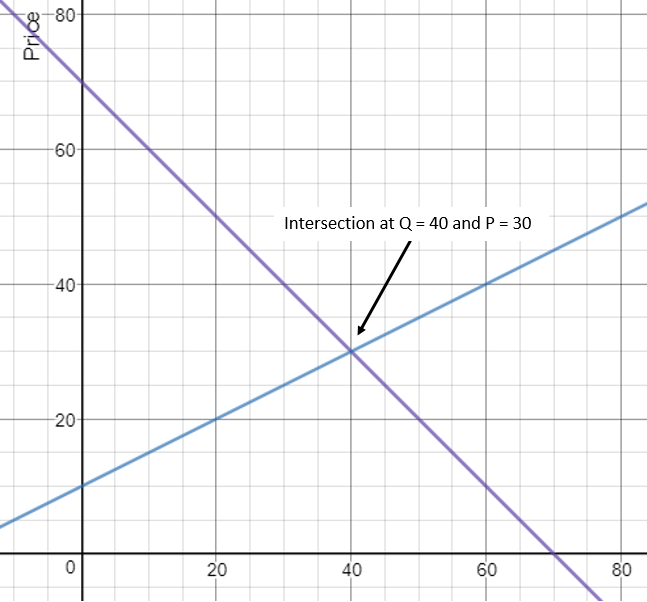
In Economics we are interested in the point where the Supply and Demand curves intersect (the point of equilibrium). We can read the coordinate of the intersection off the graph or use simultaneous equations.
Using a Graph
For example:
Supply curve:

Demand curve:

The intersection (equilibrium) is at Price = 30 and Quantity = 40.
Simultaneous equations
We use the rules of rearranging equations to solve the two equations simultaneously.
For example:
Supply curve:
Demand curve:
Step 1
Make the equations equal to each other

Step 2
Rearrange the equation by moving all Qs to the same side and any numbers to the other side to give the value of Q


Step 3
Substitute the value of Q into one of the initial equations to find the value of P.
To find P substitute Q = 40 into one of the initial equations.
 + 70")

Notice that we have the same solution as before (Price = 30, Quantity = 40)
Further example:
The following video will take you through another example of solving simultaneous equations.
Further information
- Press the Printer Friendly button at the top left-hand corner to download a printable handout
- Khan academy use video to explain another worked example where the equations are rearranged differently and a set
of practice problems that you can use to review your understanding.